Disinformation attacks on urban traffic networks
Ph.D. Student: Gururaghav Raman | Advisor: Jimmy C.-H. Peng | Collaborators: Talal Rahwan, Bedoor AlShebli, and Marcin Waniek, New York University, Abu Dhabi, UAE | Project Duration: 2018-2020
Disinformation continues to raise concerns due to its increasing threat to society. Nevertheless, a threat of a disinformation-based attack on critical infrastructure is often overlooked. In this study, we consider urban traffic networks and focus on fake information that manipulates drivers’ decisions to create congestion at a city scale.
Disinformation attack mechanism
We consider a scenario where an adversary spreads false information with the aim of manipulating the routes taken by drivers in a city. One way to do this would be to persuade drivers to move away from a certain location, either by sending fake traffic alerts informing them of an accident or heavy congestion at that location, or by deploying fake road signs redirecting traffic away from it. An alternative way in which the adversary may disrupt traffic is by manipulating drivers to move towards a target location, e.g., by sending fake alerts advertising a limited-time, massive sale at a popular retail store. We term the former scenario a “divergence attack”, and the latter a “convergence attack”. In both cases, a proportion of the recipients may follow-through on the disinformation, i.e., reroute their trips accordingly, while the remaining recipients simply ignore it and maintain their original routes. This is shown below in Fig. 1.
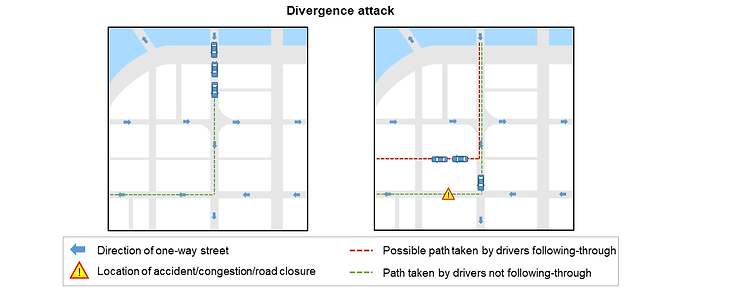

Figure 1. Illustrating divergence and convergence attacks on traffic networks.
Surveys to assess disinformation follow-through rates
We ran surveys to assess how people would react to the disinformation involved in such attacks. Although peoples’ responses in a real-life situation may not be exactly what is reported in the survey, these responses nevertheless give us an insight into how receptive people are towards such disinformation.
Starting with the divergence attack, we ran a survey on Mechanical Turk (n=3301), where each participant was shown an SMS notification whose sender is ‘SMSAlert’ and whose content is: “Accident on ‘X’ Road. Please use alternative routes. Be safe!”. The participants were then asked to specify on a Likert scale from 0 to 10 their likelihood to follow-through on the notification. Moreover, since the reach of the disinformation may increase if the recipients forward its content to others, e.g., via social media, the participants in our survey were also asked to specify their likelihood to forward the notification to their friends. Furthermore, to test peoples’ reactions when the disinformation is conveyed via a road sign, we surveyed n=1000 participants who were shown a picture depicting a road sign saying “ROAD AHEAD CLOSED”. As for the convergence attack, we recorded the responses of n=1000 survey participants who were shown an SMS notification saying “Mega sale TODAY only! 30% to 75% off all items in Target!”. The results are presented in Fig. 2 below.
For a full description of the survey and potential disinformation delivery methods, see the full paper.
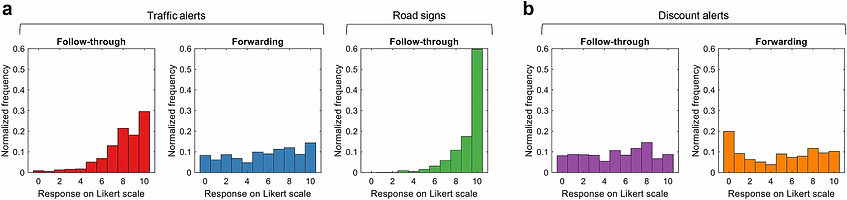
Figure 2. Assessing propensities to follow-through and forward disinformation. (a) Survey results for the divergence attack, represented as a normalized histogram summarizing the participants’ responses on a Likert scale from 0 to 10 indicating their propensity to follow-through on and forward fake traffic alerts (n=3301), and follow-through on fake road signs (n=1000). (b), The same as (a) but for convergence attacks via fake discount alerts (n=1000).
Attack impact on the road network
We consider a divergence attack on 10 locations in the city of Chicago. We simulate one day of traffic in the city, with and without the attack, and report the observed differences in traffic throughout the day, assuming that the attack happens at the beginning of the day and lasts for 24 h. The results are shown in Fig. 3. As can be seen, these targets are spread across the city, and not grouped in any particular neighborhood. Given these targets, and assuming that 50% of the drivers follow-through on the disinformation by rerouting their path to avoid the targets, Fig. 3 also depicts the change in the traffic intensity as a result of the attack, i.e., the change in the number of vehicles that traverse through each street. It can be seen that the attack diverts traffic away from the targets into neighboring streets, thereby resulting in increased traffic in certain streets (shown in red), and decreased traffic in others (shown in green). Interestingly, the impact of the attack is not confined to small neighborhoods around the targets, but rather propagates across the city.
We also investigate the possibility that instead of targeting the entire city, the adversary might concentrate the attack on one critical neighborhood, e.g., its business district, in order to cause the maximum disruption in this area. To simulate this scenario, we constrained our greedy heuristic to only target locations in the Chicago Loop, which is the central business district of the city.
Finally, to simulate a convergence attack, we consider the “Target” retail store located in downtown Chicago, and focus on vehicles whose route involves passing through a location that falls within a 1 km radius from this store. We vary the percentage of such vehicles that reroute their journeys to take advantage of the purported discount; this percentage is referred to as the follow-through rate. Furthermore, for any such follow-through rate, we add 1000 new rides originating from randomly chosen locations in the city and terminating at the target.
These results are summarized in Fig. 3. For a full description of the results, see the full paper.

Figure 3. Impact on streets across the city. (a) Given a divergence attack with 10 targets, thick lines indicate the streets targeted by our greedy heuristic. Dark blue indicates streets where only a single direction of traffic is targeted, whereas orange indicates streets that contain two targets that cover both directions of traffic. For all remaining streets, the color indicates the change in the number of vehicles passing through when the follow-though rate is 50%, with green indicating fewer vehicles, red more vehicles, and grey no change. (b) The same as (a) but the greedy heuristic is now confined to a particular neighborhood in downtown Chicago, namely, the Loop. (c) The same as (a) but instead of a divergence attack, we now have a convergence attack on the store called “Target” located in downtown Chicago. (d) The change in traffic per day as a function of the distance (in meters) from the nearest target, given the targets shown in (a) and different disinformation follow-through rates. The black plot corresponds to all roads, whereas the red and green plots correspond to only those roads where the traffic increased and decreased, respectively. The inset figures present a zoomed-in view of the red plots in the near-vicinity of the targets. Results are averaged over 100 simulations, with the shaded areas representing the 95% confidence intervals. (e) The same as (d) but for the target locations shown in (b). (f) The same as (d) but for the convergence attack on the location shown in (c).
Attack impact on the rides
The distribution of delays experienced by the rides in the city are shown below in Fig. 4 for both divergence and convergence attacks.
We find that regardless of the type of the attack and the follow-through rate, the ride time increases for some drivers and decreases for others. This might be surprising at first glance, as one would expect the removal of edges from a road network to only have a negative impact on travel time. This, however, is not always true, due to what is known as Braess’ paradox, a phenomenon where the removal of some streets from a network has the counter-intuitive effect of reducing the ride times for some drivers; there is theoretical and empirical evidence suggesting that this phenomenon is not uncommon.
Further, increasing the follow-through rate increases the variance of the time-delay distributions, with more vehicles experiencing longer delays.

Figure 4. Impact on rides across the city. (a) Given varying disinformation follow-through rates (indicated in bold), the distribution of the additional ride time experienced by drivers after a divergence attack on 10 targets across the city, chosen either by our greedy heuristic or at random. (b) The same as (a) but for convergence attacks. The inset depicts the same distribution but instead of considering all rides, it considers only those that do not pass within 1 km of the target location. All results are shown as an average over 100 simulations.
Summary
We have shown that in the age of disinformation, an adversary no longer needs to tamper with traffic control systems, but can instead focus entirely on manipulating the drivers themselves to disrupt traffic in a city. More broadly, our study provides a new perspective on the security of critical infrastructure, demonstrating that vulnerabilities can emerge not only from the hardware and software, but also from the behavior of the individuals interacting with the system.
Supplementary data file
Supplementary Materials are available here. The street network of Chicago used in this study is available for download here.
Related works
Gururaghav Raman, Bedoor AlShebli, Marcin Waniek, Talal Rahwan, and Jimmy Chih-Hsien Peng, "How weaponizing disinformation can bring down a city's power grid", https://journals.plos.org/plosone/article?id=10.1371/journal.pone.0236517.